Viewing the Analytics data
Once we have had some traffic received by the application Virtual Servers and processed by the Analytics profile, we can now go in to view and analyze this data.
In the BIG-IP GUI, go to Statistics >> Analytics >> HTTP >> Overview
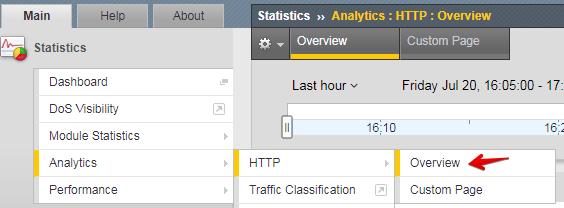
This page shows you details about the traffic received by every Virtual Servers that had the HTTP Analytics profile attached.
You can filter and update the graphs, by selecting one or more Virtual Servers from the filters on the right. Selecting one or more Virtual Servers will update the graphs to show data only for the selected Virtual Servers. You can also choose from other filter options, like Pool Members, URLs, Client IP Addresses, etc. Feel free to explore the various graphs and filter options on your own.
You can also go to the the Statistics >> Analytics >> HTTP >> Custom Page, and customize the various widgets shown.
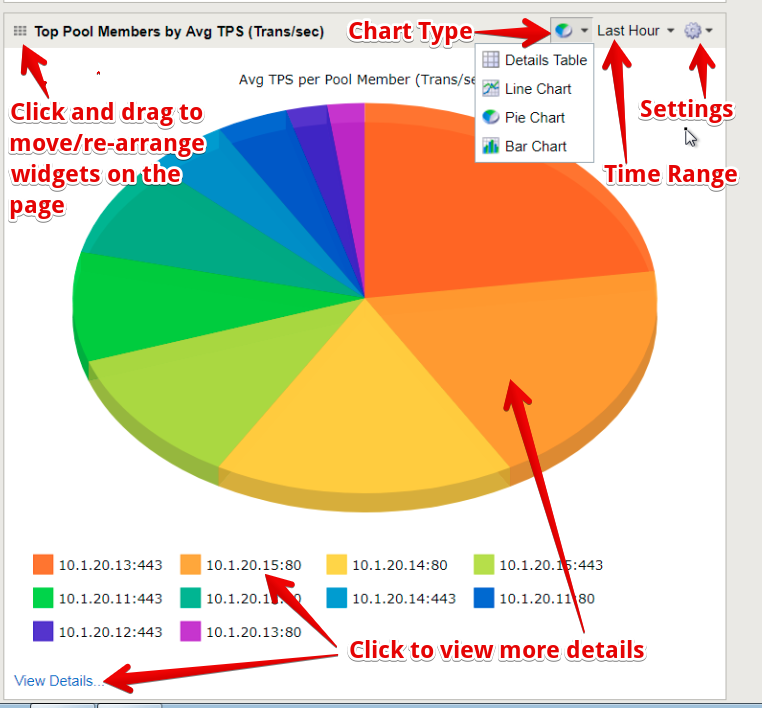
You can move the widgets around and re-arrange the page by simply dragging-and-dropping the widgets from the top-left corner of each widget. add more widgets on the page by clicking the Add Widget button at the bottom of the page.
Similarly, you can modify the tables on the right side of the page, and add another table by clicking the Add Widget button below the last table on the right.
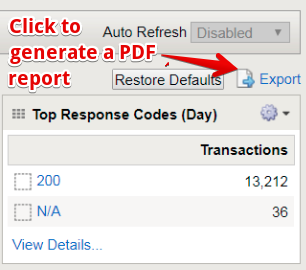
Once you have updated the page to show you the data you want, you can create a report by clicking the Export button at the top-right of the page.
We encourage you to explore the different widgets and graphs on the page, and change the settings on each to view and analyze the data by various metrics.